Callstack from Userland to Kernel-space

When I started my PhD 4 years ago, I had the chance to play with a nice tool (but ST internal ...) that does advanced Linux kernel debugging. Among its capabilities, one thing that astonished me was the ability to show a full call stack, from userland down to kernel-space :
                      #0  context_switch ()       at kernel/sched.c:2894
                      #1  schedule ()             at kernel/sched.c:5500
                      #2  do_nanosleep ()         at kernel/hrtimer.c:1494
                      #3  hrtimer_nanosleep ()    at kernel/hrtimer.c:1563
                      #4  sys_nanosleep ()        at kernel/hrtimer.c:1601
                      #5  ret_fast_syscall ()     at arch/arm/kernel/entry-armv.S:744
                      #6  nanosleep ()            at lib/nanosleep.c:51
                      #7  sleep ()                at unix/sysv/linux/sleep.c:138
                      #8  main ()                 at sleep.c:4
That may look trivial at the first sight, but the top part of the stack (#0 - #5) belongs to the kernel (Linux), whereas the bottom part belong to user-space. Frame #8 is the application itself, and #7/#6 the libc.
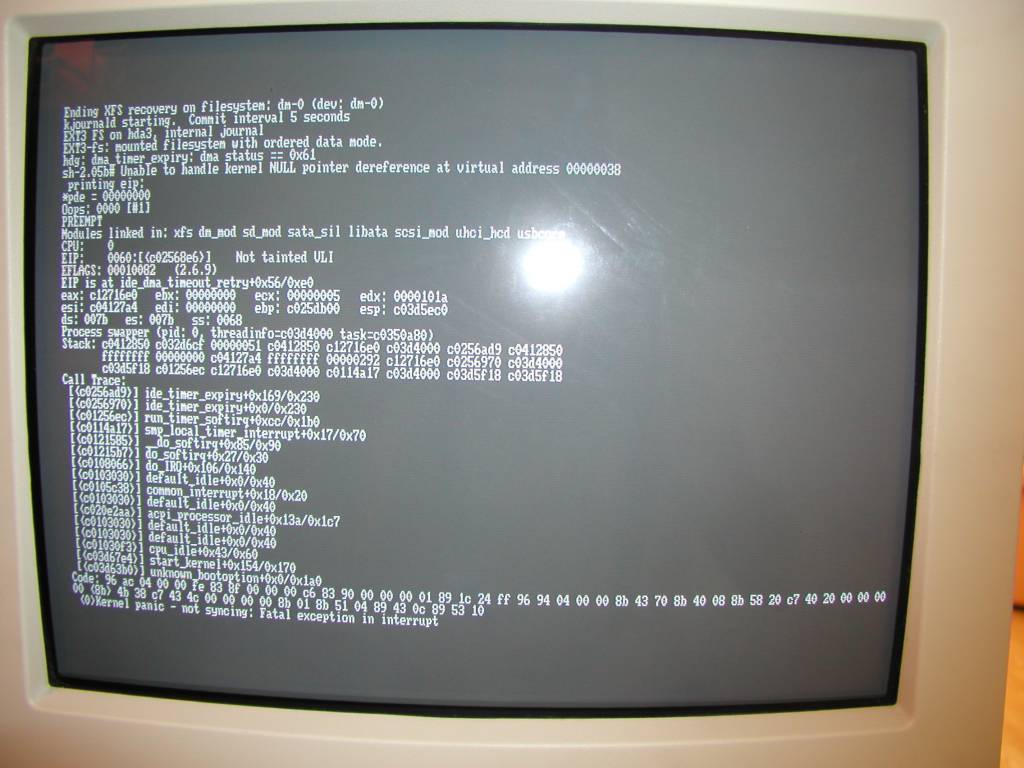
Generating such a trace is impossible in a standard environment, as the kernel runs in a protected memory area, that is not address the same way as userland.
This particular example comes from a work I did, where I had to port the low-end of the kernel debugger to support ARM processors running on Qemu virtual machine. I studied the __copy_to/from_user() kernel functions to understand how the kernel does to lookup userland addresses from kernel space, and reimplemented the same logic inside the debugger.
As far as I remember, that involved modifying the registers of the machine's MMU, which is the unit in charge of mapping virtual addresses to physical ones. So the debugger had to reprogram it with the memory context of the current process, ask Qemu to convert the address, and reinstall the original process (otherwise ... system crash and kernel panic!).
* Attentive readers may have noticed that, unfortunately, this is not the complete stack, ~half of it is still missing! The callstack doesn't start magically from the
mainfunction ... With gdb
set backtrace past-main onand
set backtrace past-entry onwe can see what happened before the
main(that is, in the
libc), but we won't be able to get past that today ...
#3  0x00000000004018ed in main () at src/sleep.c:145
#4  0x0000003d49221d65 in __libc_start_main () at libc-start.c:285
#5  0x00000000004019f9 in _start ()

 (gdb) break *0x972