(gdb) break *0x972

Debugging, GNU± Linux and WebHosting and ... and ...

Photowall generator

Thursday, February 04, 2016 - No comments

This is a GPL 3.0 Python photowall generator, relying on ImageMagick. It is (and will remain) in "beta testing" version : I use it and it fits my requirements, but there is no guarantee that it won't crash in any different circunstances.

Python developers should be able to fix it and update it fairly easy, although the code is a bit old and could benefit from a face lifting (I wrote it in 2012).

An example of customization for Python developers: Polaroid captions are computed by function photowall.get_file_details. Just rewrite this function to decide what you want to use for caption. Current code (in the exception handler :$) takes the filename without extension and replaces underscores by new lines.

Usage:

 photowall.py <path> <target> [options]

 Arguments:
   <path>        The path where photos are picked up from.
   <target>      The path where the target photo is written. 
                 Except in POLAROID+RANDOM mode, the image will 
                 be blanked out first.

 Options:
   --polaroid      Use polaroid-like images for the wall
   --pick-random   Pick images randomly in the <path> folder.
   --help          Display this message

 Size options:
   --nb-lines <nb>         Number on lines of the target image. 
   --line-height <height>  Set the height of a single image.
   --width <width>         Set final image width. 
   --no-resize    Resize images before putting in the wall.

 Polaroid mode options:
   --crop-size <crop>      Minimum size to allow cropping 
                           an image, if it doesn't fit
   --no-caption            Disable caption.
   --put-random            Put images randomly
                           instead of linearily.
   --sleep <time>          If --put-random, time (in seconds)
                           to go asleep 
                           before adding a new image.

 Collage mode options:
   --do-wrap               Finish images on the next line? 

Examples

Polaroid mode with caption

--polaroid  --nb-lines 1 --pick-random

Polaroid mode with caption

Polaroid mode with no caption

--polaroid --no-caption --nb-lines 1 --pick-random

Polaroid mode with no caption

Collage mode

--nb-lines 1 --pick-random

Collage mode

Polaroid random mode

--put-random --nb-lines 1 --pick-random

Polaroid random mode

Graphical interface

I built a graphical interface that should support all the command-line arguments. Use it with caution, I don't like writting GUIs !

GUI

Hacktoberfest 2015

Sunday, January 10, 2016 - No comments

During the month of October, I participated to DigitalOcean's Hacktoberfest. The goal is to foster Open Source programming, and the rule is easy: you just have to submit 3 pull-requests on Github. No matter the size of the pull request, no matter which project, big, small, even your own project, and the pull request doesn't even have to be accepted. It's easy to "cheat", but I played to game fairly and prepared three pull-request with actual features/improvements.

Selfloss RSS Reader

Add support for private (@) and hidden (#) tags

Selfloss is a PHP feed reader, with a per-source tagging mechanism. I needed two things:

1/ private tags (with a @ in the tag name): items and sources with such tags are not visible if the user is not logged in.

2/ "not important" tags (with a # in the tag name): items are not visible in the "all tags" feed, but only when you click directly on the tag or source.

Orochi

Add Python 3 support

Orochi is a command-line client for 8tracks online music player. It didn't support Py3, which is the default on my Archlinux system. Instead of fixing shebang, I updated the code to support Python 3.

PyQuadStick

Add a keyboard controller

PyQuadStick/PyQuadSim is a quadcopter simulator written in Python for the Virtual Robot Experimentation Platform (V-REP). PyQuadStick worked with R/C transmitters, joysticks and PS3 controllers, but I had none of them, so I wrote and contributed a keyboard controller.

Shaarli

Allow setting custom thumbnails

Shaarli is a micro-blogging engine, focused on link sharing. For my online library, I wanted to be able to provide custom thumbnails, for the book covers. Unfortunately (for my patch), they are in the middle of a refactoring, with a focus on plugins, to not clober the core of the engine and keep it minimal. So I rewrote my original patch to fit that design, but it won't be included until the refactoring is done.

Computing Scubadiver Air Consumption

Wednesday, May 06, 2015 - No comments

When you're scubadiving, one important thing is to keep track of the air you've got left in your tank, and more importantly, how fast it goes down.

Just a quick reminder for non-scubadiver readers: the deeper you are, the more air you consume, because of the increased pressure. At surface level (1atm/~1bar), your lungs can hold ~7l of air. At 10m (2atm), they'll hold the equivalent of 14l of air. That's 21l at 20m, 28l at 30m and 35l at 40m. That means that if you hold your breath from 40m to surface, you'll literally explode! It also means that you don't consume the same quantity for air depending of your diving depth.

And what I wanted to do is estimating the air consumption speed. Of course I could buy a diving computing connected to the tank gauge, but that's out of my budget. So I programmed it :-) With my dive computer, I do have a report of the dive depth, every 20s :

Dive depth profile

I also know the volume of my tank (12l or 15l, carved on the tank), the initial pressure (usually ~200/230bar) and the end-of-dive pressure (100bar here), read on the gauge. Of course this is approximate, but that's the poor man way! I retrieve the figures of the dive depth and time inside my Subsurface XML divelog, as well as the dive tank information:

<divecomputer model='Suunto Vyper' deviceid='5aa559db' diveid='8f75b186'>
  <depth max='10.058 m' mean='6.601 m' />
  <temperature air='17.0 C' water='17.0 C' />
  <sample time='0:00 min' depth='0.0 m' />
  <sample time='0:20 min' depth='1.829 m' />
  <sample time='0:40 min' depth='2.134 m' />
  <sample time='1:00 min' depth='2.743 m' />
  <sample time='1:20 min' depth='3.353 m' />
  <sample time='1:40 min' depth='3.658 m' />
  <sample time='2:00 min' depth='4.267 m' />
  <sample time='2:20 min' depth='4.572 m' />
  <sample time='2:40 min' depth='4.572 m' />
 <! --... -->

And now, I can start computing my air consumption.

Computing The Air Consumption

What I know for my calculation:

  • at Ti I was at depth Di, and at Ti+1, I was at Di+1, so I assume that I spent Ti+1 - Ti seconds at (Di+1 + Di)/2 meters. I know this is a very simplistic, but as Ti+1 - Ti is 20s for my computer, so no more that a few meters, that's good enough for my purpose.
  • pressure at depth Dmeters is Pi = abs(Di)/10 + 1atm/bar
  • the initial air volume Vstart of my tank depends of its size Stank and its pressure Ptank. Vstart = PtankxStank (for all the tanks used of course)
  • the same applies for the end-of-dive volume, Vstop. I consumed Vconso = Vstart - Vstop litters of air during the dive.

Now, I need to distribute Vconso over the dive, but paying attention to different dive depths. So, for all Ti and Pi,

  • I compute the "equivalent surface time" Teq.surf = Ti * Pi in minutes, which is "the time required at surface level to breath the same quantity of air than Ti minutes at Pi atm".
  • I sum up all these durations
  • and I compute the air consumption by diving the breathed air volume by this surface-equivalent duration.

For my last dives, this gives:

  • 16l/min (1650l pour 98min.eq.surface) (44min, 20m max, 12m avg, water 14/15*)
  • 14l/min (1650l for 113min.eq.surface) (43min, 34m max, 16m avg)
  • 16l/min (1800l for 111min.eq.surface) (45min, 19m max, 14m avg)
  • 16l/min (1500l for 92min.eq.surface) (40min, 19m max, 13m avg)
  • 29l/min (900l for 30min.eq.surface) (short cave dive, 15min 17m max, 10m avg, cold water 13*)
  • 27l/min (1638l for 59min.eq.surface) (shallow dive, 36min 10m max, 6m avg, water 17* but dive suit too large)
  • 18l/min (1740l for 91min.eq.surface) (diving pool, 36min,19m max, 15m avg)

and I didn't write down enough details for the previous ones.

It's hard to tell if the computation is good enough, the last 4 dives (top of the list), where during the same weekend and the consumption are every homogeneous, but the 2 previous ones are surprising. Maybe the cave dive was a bit stressful, even if I didn't notice it, maybe I didn't write correctly the tank sizes correctly (I also had to breath on 2 independent tanks), and for the dive at 27l/min, my suit was too large, I could feel cold water each time I was breathing, I don't know if that explains the figures twice as high ... or my computations are just wrong !

def get_conso(xml_dive, volume):
    surface_eq_time = 0.0

    def subsurface_time_to_minutes(sub_time):
        mn, sc = [int(ent) for ent in sub_time.split(":")]
            return mn + sc/60

    time, depth = 0.0, 0.0
    for sample in xml_dive.find("divecomputer").findall("sample"):
        new_time, new_depth = [sample.get(entry).split()[0]
                               for entry in ("time", "depth")]

        new_time = subsurface_time_to_minutes(new_time)
        duraction = new_time - time

        new_depth = float(new_depth)
        sample_depth = get_sample_depth(depth, new_depth)

        presure = abs(sample_depth) / 10 + 1 # meters to atm presure

        surface_eq_time += presure * duraction

        time, depth = new_time, new_depth

    return int(volume/surface_eq_time)

Actual function is there: http://git.0x972.info/subsurface2jinja.git/tree/subsurface2conso.py

Project: Igot-U GPS tracker to FUSE Filesystem (igotu2fs)

Thursday, August 15, 2013 - No comments

I recently bought a GPS tracker, the Igot-U GT-120, to record my hiking/biking/skying paths (a headless replacement for my Android phone running Google’s MyTracks).

So far it appears to work very well, the last thing I need to check is the battery, how long it can record without recharging.

In my Unix workstations (Fedora and Archlinux), I compiled igotu2gpx. I works perfectly fine, both the command-line version and the QT-based GUI. It is also compatible with GPSd and its clients, which means that I can use it as a “normal” GPS, to get the current position, speed, etc. (Maybe another project for the Raspberry Pi?)

Files are exported as standard GPX files, so you can use it with your favorite visualizers (Visu GPX, GPS Visualizer).

However, igotu2gpx interface does not allow much more than listing, retrieving and removing the files from the device (it can also plot them in a Marble map, but that’s not my point). And that’s what filesystem usually does, and that’s the interface I would like to see for such a device.

Hence, as soon as I’ll have time (this fall I guess), I’ll start developing a FUSE interface for igotu2gpx. I initially planned to built it from scratch, with Python FUSE bindings, but I’ll certainly directly extend igotu2gpx codebase and hence do it in C.

Just let me know if you’re interested in using this project or helping in its development, I’ll start faster in this case ;-)

Project: Meteo Data Plotter

Tuesday, August 13, 2013 - No comments

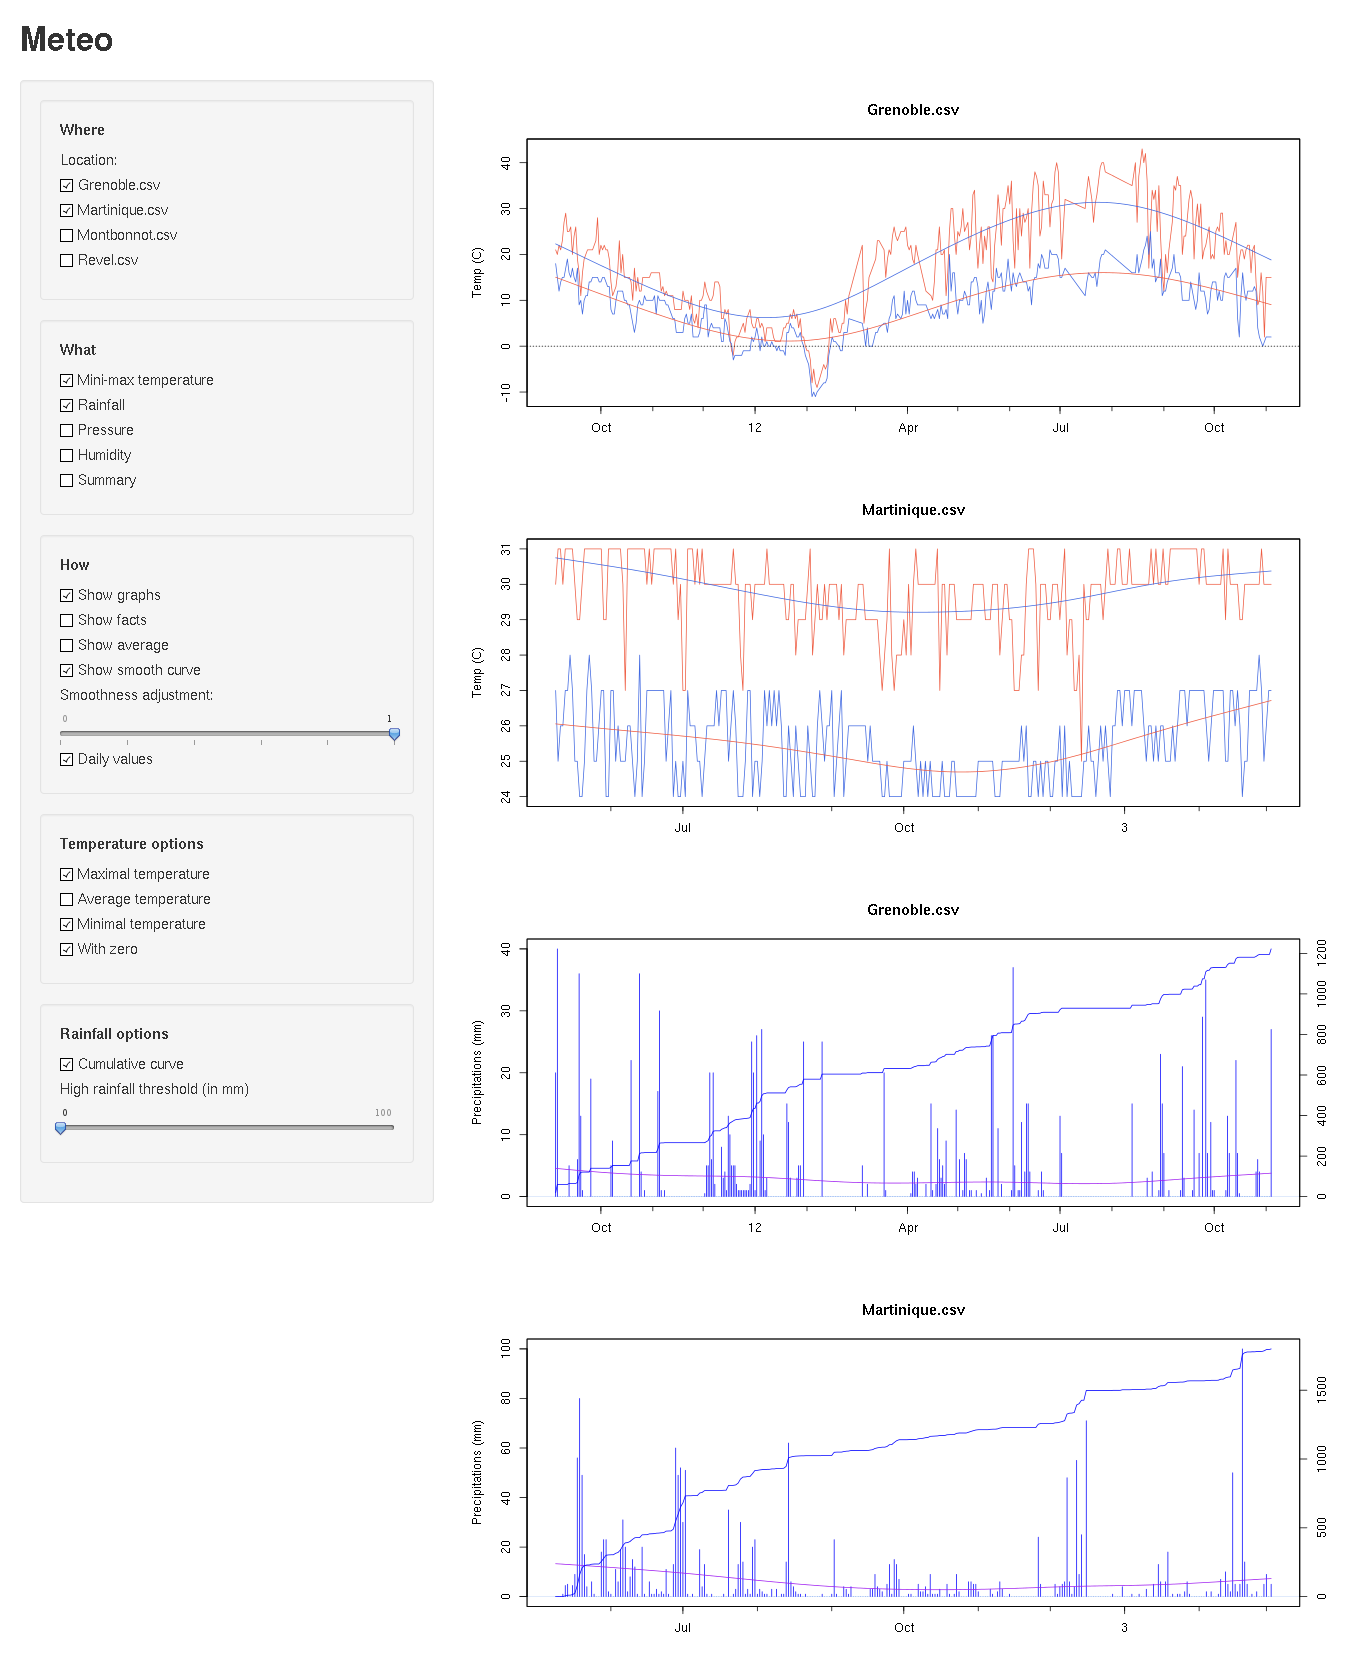
The [Meteo-Data-Plotter|https://raw.github.com/wazari972/Meteo-Data-Plotte] project is a [R|http://www.r-project.org/] application showing the weather data I collected during the l few years.

It’s main interface is a [Shiny reactive website|http://www.rstudio.com/shiny/], as illustrated below. It can also export PDF, through R native interface.

[Source data|https://raw.github.com/wazari972/Meteo-Data-Plotter/master/Grenoble.csv] have to be formatted in CSV and look like that:

[code]Date |Temp.min|Temp.max|Humidity|Rain|Pressure|Comments --------|--------|--------|--------|----|--------|------------ 04/09/11|18 |21 |89 |20 |25 | 05/09/11|15 |20 |80 |40 |25 |Heavy rainfalls 06/09/11|12 |22 |62 |0 |24 | 07/09/11|14 |21 |67 |0 |24 | 08/09/11|15 |23 |68 |0 |25 |[/code]

The graph part is neat and ready to use. Next step is to a “textual” information, like the day/month it most rained, temperature peak, etc.

For the graphs, possible improvements would be date selection or a better way to compare two file (currently they’re just plotted one on top of the other).